Publications
Running on Empty: Burnout and Work Disengagement
Introduction: when motivation runs out at work
People who burn out were usually motivated once, often very much so. Over months or years they lose their energy, the meaning they found in the job, and the belief that their effort changes anything. Tiredness is only the first part of it.
That is why burnout can be read as a form of demotivation. It shows a working environment wearing down someone's investment, and the person pulling back to protect themselves. Pulling back helps for a while. Then it becomes part of the problem.
What follows is the state of the research as of May 2019: Maslach's model and the Job Demands-Resources model, the line between burnout and depression, what the numbers say, and which interventions have been tested.
What burnout is: from clinical observation to classification
The term came from clinical observation, not from theory. In 1974 the psychoanalyst Herbert Freudenberger described the gradual exhaustion and loss of commitment he saw in volunteers at a New York free clinic, himself included (Freudenberger, 1974). Around the same time, the social psychologist Christina Maslach was interviewing human-service workers about how they coped with emotionally draining work.
Maslach's work gave the field its standard definition. Burnout is a psychological syndrome that develops in response to chronic interpersonal stressors on the job, with three dimensions (Maslach, Schaufeli & Leiter, 2001):
- Exhaustion: feeling overextended and drained of emotional and physical resources. Maslach calls it the stress dimension.
- Cynicism, or depersonalization in the original human-services version: a negative, callous or detached response to the job and to the people one serves.
- Reduced professional efficacy: feeling incompetent, achieving little, being less productive.
As of May 2019, burnout is not a mental disorder in DSM-5. ICD-10 mentions it only in passing, as code Z73.0 ("burn-out: state of vital exhaustion") among problems related to life-management difficulty. ICD-11, released by the World Health Organization in June 2018 and due before the World Health Assembly this month, describes it in more detail under code QD85: a syndrome resulting from chronic workplace stress that has not been successfully managed, with the same three dimensions. Clinicians should note two things. QD85 is in the chapter on factors influencing health status, not among the mental disorders. And the term is reserved for the occupational context (World Health Organization, 2018).
The Maslach model: burnout as a person–job mismatch
Maslach's central claim is that burnout is a chronic mismatch between the person and their job, rather than a personal weakness (Maslach & Leiter, 2016). The more the job and the worker are misaligned, the greater the risk.
Leiter and Maslach (2004) identified six areas of worklife where this mismatch usually shows up:
| Area of worklife | What a mismatch looks like | Psychological need at stake |
|---|---|---|
| Workload | Too much work, too little time or recovery | Energy and recovery |
| Control | Little say in how the work is done | Autonomy |
| Reward | Effort not recognised, financially or socially | Recognition and esteem |
| Community | Poor relationships, conflict, isolation | Belonging and support |
| Fairness | Decisions seen as unjust or arbitrary | Justice and trust |
| Values | Work at odds with one's own values | Meaning and integrity |
Read the last column of the table. Each area of worklife maps onto a basic psychological need, and when that need stays frustrated for long enough, the person stops investing. Workload mismatch feeds exhaustion most directly. Mismatches in values, fairness and community feed cynicism, which is where the motivational damage lies.
The usual psychological sequence runs from exhaustion to cynicism. Cynicism can be read as a defensive move: distancing oneself from work and people reduces further emotional loss. But it also cuts the person off from the sources of meaning that kept them motivated. Reduced efficacy can develop alongside the other two or follow from them.
How burnout is measured
The Maslach Burnout Inventory (MBI) is the reference instrument. Rotenstein et al. (2018) found that 85.7% of the physician burnout studies they reviewed used a version of it. Items are rated on a 7-point frequency scale (0 = never, 6 = every day).
| Instrument | Population | Items | Dimensions |
|---|---|---|---|
| MBI-Human Services Survey (Maslach & Jackson, 1981) | Human-service workers (health, social work) | 22 | Emotional exhaustion (9), depersonalization (5), personal accomplishment (8) |
| MBI-Educators Survey | Teachers | 22 | Same three as the HSS |
| MBI-General Survey (Schaufeli et al., 1996) | Any occupation | 16 | Exhaustion (5), cynicism (5), professional efficacy (6) |
| Oldenburg Burnout Inventory (Demerouti et al., 2001; Halbesleben & Demerouti, 2005) | Any occupation | 16 | Exhaustion, disengagement; positively and negatively worded items |
| Copenhagen Burnout Inventory (Kristensen et al., 2005) | Any occupation; free to use | 19 | Personal, work-related and client-related burnout |
| Burnout Assessment Tool, BAT-23 (Schaufeli, De Witte & Desart, 2019) | Any occupation; work-related and general versions | 23 core + 10 secondary | Core: exhaustion (8), mental distance (5), cognitive impairment (5), emotional impairment (5). Secondary: psychological distress, psychosomatic complaints |
| Utrecht Work Engagement Scale (Schaufeli et al., 2002; 2006) | Any occupation; measures the positive pole | 17 or 9 | Vigour, dedication, absorption |
The BAT is the newest entry, developed at KU Leuven and still circulating as an internal report in 2019. Its authors drop professional efficacy from the core of the syndrome and add cognitive and emotional impairment: trouble concentrating and remembering, and difficulty controlling emotional reactions at work. Items use a 5-point scale from never to always. Unlike the MBI, it was built for individual assessment as well as research, though its manual stresses that a score is not a diagnosis. Peer-reviewed validation data were not yet available at the time of writing.
One caution about the MBI. It was designed to measure burnout as a continuum on three separate scales. It was not designed as a diagnostic tool, and its authors do not recommend summing the scales or using fixed cut-offs. Practice has nevertheless produced many cut-offs. Rotenstein et al. (2018) counted at least 142 different definitions of "burnout" or of its subscales across 182 studies. This is the single biggest reason prevalence figures vary so much from one study to another.
The Job Demands-Resources model: two processes, one balance
The Job Demands-Resources (JD-R) model, proposed by Demerouti, Bakker, Nachreiner and Schaufeli (2001), widened the lens. It applies to every occupation, not only human services. It also explains burnout and its positive opposite, work engagement, within one framework.
The model sorts every working condition into two groups:
- Job demands require sustained physical or psychological effort: workload, time pressure, emotional demands, role conflict. They have a physiological and psychological cost.
- Job resources help people reach their goals, soften the cost of demands, or let them grow: autonomy, social support, feedback, coaching from a supervisor, chances to develop.
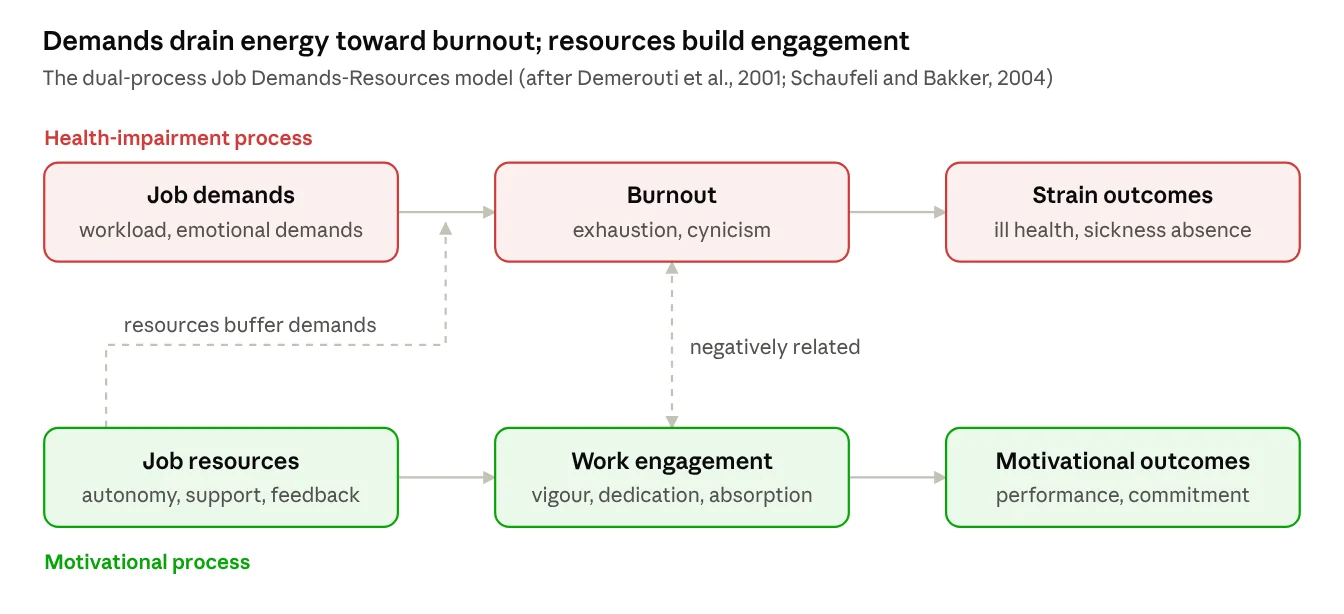
Each group drives its own psychological process (Schaufeli & Bakker, 2004; Bakker & Demerouti, 2017). In the health-impairment process, high demands kept up over time wear down energy, leading to exhaustion and later to health problems. In the motivational process, resources feed engagement (vigour, dedication, absorption), and engagement predicts performance and commitment. A shortage of resources is a demotivation story of its own. In Schaufeli and Bakker's (2004) data, low resources predicted disengagement, and disengagement predicted the intention to leave.
Later research added two refinements that matter in practice.
- Demands differ in kind. In a meta-analysis by Crawford, LePine and Rich (2010), demands that people appraise as hindrances (red tape, role ambiguity, conflict) went with lower engagement. Demands appraised as challenges (responsibility, time pressure on meaningful tasks) went with higher engagement. Both kinds went with more burnout. How the person appraises a demand changes what it does to their motivation.
- Personal resources count too. Newer versions of the model include self-efficacy, optimism and resilience (Bakker & Demerouti, 2017). Gains in resources tend to bring further gains, and losses further losses. The idea comes from Hobfoll's (1989) Conservation of Resources theory, in which stress starts with the threat or the actual loss of something a person values.
So a person can work under heavy pressure and stay engaged if their resources are good. Take away control, support or recognition, and the same person can lose motivation with no change at all in workload.
Burnout, depression or disengagement?
In the consulting room, a person who says "I'm burned out" may be describing three different things. They overlap, and they call for different responses.
| Burnout | Depression | Disengagement (low engagement) | |
|---|---|---|---|
| Scope | Tied to work (ICD-11 restricts the term to the occupational context) | Pervasive: affects all areas of life | Tied to work, often to a specific job or employer |
| Energy | Exhaustion, especially at the end of the working day and the week | Fatigue and loss of energy across contexts | Usually preserved; energy goes elsewhere |
| Pleasure | Can often still enjoy weekends and holidays, at least early on | Anhedonia, also outside work | Interest preserved outside work |
| Attitude to work | Cynicism, distancing, irritability toward clients and colleagues | Guilt, worthlessness, hopelessness that generalise | Indifference, minimal effort, "quiet" detachment |
| Diagnostic status | Not a mental disorder (ICD-11 code QD85, occupational phenomenon) | Mental disorder (DSM-5; ICD-10 F32–F33) | Not a clinical construct |
| Typical measures | MBI, OLBI, CBI | PHQ-9, BDI-II, structured interview | UWES, Gallup Q12 |
The boundary between burnout and depression is the most contested one in the literature. Bianchi, Schonfeld and Laurent (2015) reviewed the evidence and argued that the overlap is large enough to question whether burnout is a distinct entity at all. Their point is uncomfortable but useful: severe exhaustion with pervasive loss of pleasure should be assessed as possible depression, whatever the patient calls it.
Other data point the other way. A meta-analysis of studies published between 2007 and 2018 found a correlation of r = .52 between burnout and depression and r = .46 between burnout and anxiety (Koutsimani, Montgomery & Georganta, 2019). Correlations of that size mean the constructs are related, not identical, and the authors concluded that they are distinct. In the Finnish Health 2000 study, which used structured diagnostic interviews on a representative sample, about half of the people with severe burnout also met criteria for a depressive disorder (Ahola et al., 2005). Burnout therefore raises the risk of depression without being the same thing.
In practice, assess both. A burnout questionnaire on its own can miss a major depressive episode, and calling a depression "stress at work" delays the right treatment.
How common is it? The data up to 2019
Engagement is the easier of the two to count, because large surveys have measured it in the same way for years. Gallup's State of the Global Workplace report, based on World Poll data collected in 155 countries between 2014 and 2016, put the share of engaged employees at 15% worldwide. Another 67% were "not engaged" and 18% "actively disengaged" (Gallup, 2017).
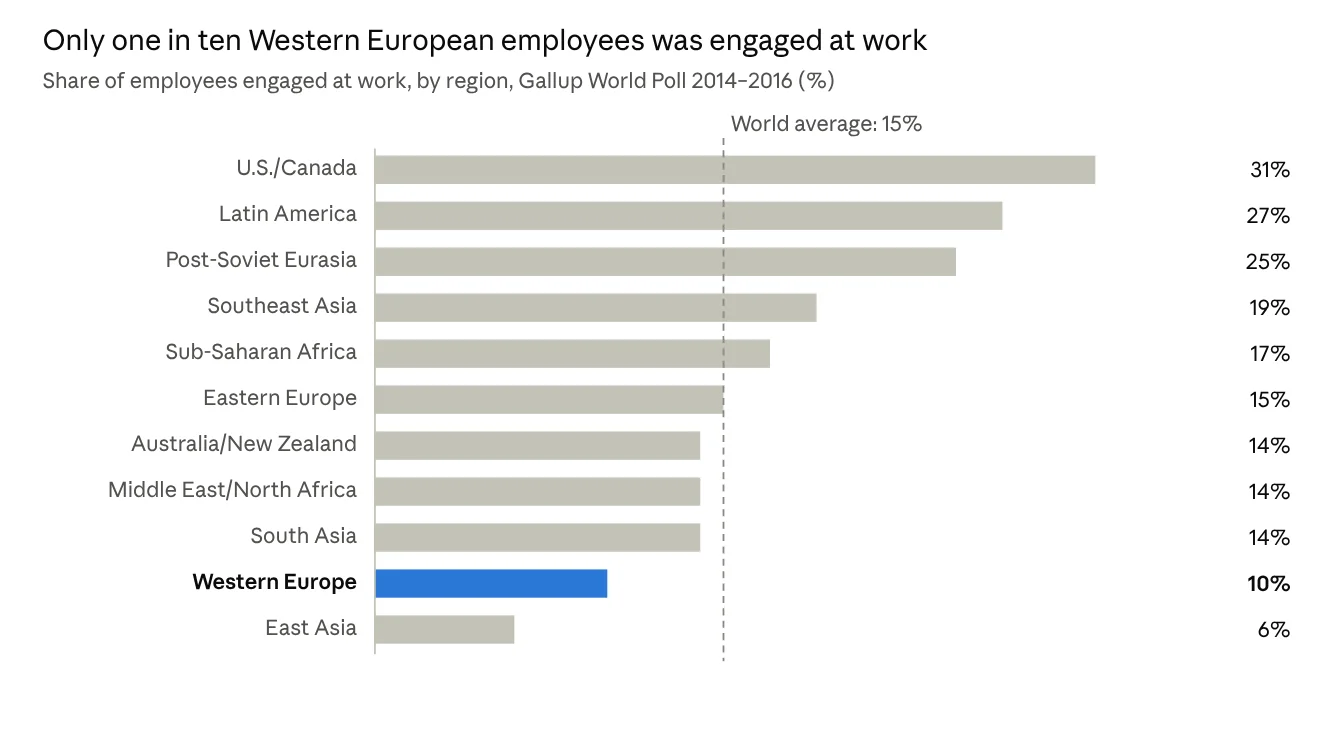
Western Europe was second from the bottom, with 10% engaged and 19% actively disengaged. Gallup's surveys are run by a consulting firm and its Q12 instrument measures workplace conditions as much as a psychological state, so the figures are best read as an indicator of trends and regional differences, not as a clinical prevalence.
Burnout is harder to count. In a Gallup survey of almost 7,500 full-time U.S. employees, 23% said they felt burned out at work "very often" or "always", and another 44% "sometimes" (Wigert & Agrawal, 2018). Self-reported frequency of feeling burned out is not the same as the syndrome measured by the MBI, though.
The population-based Finnish Health 2000 study, which used the MBI-General Survey on a representative sample of employees, found mild burnout in about a quarter of workers and severe burnout in 2.4% (Ahola et al., 2006).
In Europe there is still no harmonised figure. Eurofound (2018) asked its national correspondents in the 28 EU member states and Norway to collect the available data. The definitions, instruments and methods differed so much that the national figures could not be compared. Two patterns did recur: prevalence was higher in self-reported data than in medical diagnoses, and it was usually higher among women than among men.
Physicians are the best-studied group, and they show the measurement problem most clearly. Rotenstein et al. (2018) reviewed 182 studies covering 109,628 physicians in 45 countries. Reported burnout prevalence ranged from 0% to 80.5%. That range tells us more about the 142 different definitions in use than about physicians themselves.
What burnout costs
The strongest evidence comes from prospective studies, where burnout is measured first and health is followed afterwards. Salvagioni et al. (2017) reviewed 36 such studies of adequate quality.
| Domain | Outcomes predicted by burnout in prospective studies |
|---|---|
| Physical | Hypercholesterolaemia, type 2 diabetes, coronary heart disease, hospitalisation for cardiovascular disorders, musculoskeletal pain, prolonged fatigue, headaches, gastrointestinal and respiratory problems, severe injuries, mortality before age 45 |
| Psychological | Insomnia, depressive symptoms, use of psychotropic and antidepressant drugs, hospitalisation for mental disorders |
| Occupational | Job dissatisfaction, absenteeism, new disability pensions, presenteeism |
Source: Salvagioni et al. (2017). Some findings conflicted across studies.
The Finnish cohort gives a sense of scale. Over the follow-up, a new disability pension was granted to 22% of employees with severe burnout at baseline, 6% of those with mild burnout and 2% of those without (Ahola et al., 2009). Severe burnout was also linked to medically certified sickness absence, independently of existing mental and physical disorders. The odds ratio was 6.9 for men and 2.1 for women (Ahola et al., 2008).
Gallup's survey data point the same way at the workplace level. Employees who very often or always felt burned out were 63% more likely to take a sick day and 23% more likely to visit an emergency room (Wigert & Agrawal, 2018).
In health care the costs fall on patients too. Physician burnout has been associated with more medical errors and lower patient satisfaction (Rotenstein et al., 2018). Most of these studies are cross-sectional, so the direction of the link is not settled.
What helps
Interventions work, but modestly, and changing the organisation works better than training the individual. That is the conclusion of the two main meta-analyses available in 2019, both on physicians.
| Meta-analysis | Studies | Result |
|---|---|---|
| West et al. (2016), The Lancet | 15 randomised trials and 37 cohort studies | Overall burnout fell from 54% to 44% |
| Panagioti et al. (2017), JAMA Internal Medicine | 20 comparisons from 19 studies, 1,550 physicians | All interventions: SMD = −0.29 (95% CI −0.42 to −0.16) Organisation-directed: SMD = −0.45 (95% CI −0.62 to −0.28) Individual-directed: SMD = −0.18 (95% CI −0.32 to −0.03) |
In Panagioti et al. (2017), the individual programmes were mostly mindfulness-based stress reduction and educational courses. The organisational ones mostly reduced workload or changed schedules. An overall SMD of −0.29 is a small effect, about 3 points on the MBI emotional exhaustion scale beyond the change seen in controls. The authors read the larger organisational effect as evidence that burnout is a problem of the whole system, not of the individual doctor.
This has an uncomfortable implication for psychologists. Individual therapy and stress-management training are what we usually offer, and on their own they address the smaller part of the problem. The Finnish data add a warning. Employees with severe burnout were more likely to have taken part in individual-focused interventions and less likely to have had occupational ones (Ahola et al., 2007). Individual help seems to arrive late and alone.
A reasonable sequence for a psychologist who sees a patient with suspected burnout:
- Measure the symptoms with a validated instrument (MBI-GS or OLBI; the BAT if one wants to try the newer tool) and treat the score as a continuous indicator, not a diagnosis.
- Screen for depression and anxiety with separate instruments and a clinical interview. Send the patient for a medical check if fatigue could have a physical cause.
- Map the six areas of worklife and the balance of demands and resources. Look for which basic need is being frustrated.
- Work on two levels. With the patient: recovery, sleep, psychological detachment from work, appraisal of demands, the values question. With the patient's consent, and where possible: workload, control and support in the workplace, through the occupational physician or the employer.
- Plan a gradual return to work, because the conditions that produced burnout are usually still there.
Open questions
The field still lacks an agreed way to say who has burnout. Without it, prevalence figures from different countries and professions cannot be compared, and a clinician has no threshold to work with. The ICD-11 description and newer instruments built for individual assessment may change that, but the evidence is not in yet.
My own reading is that burnout is best treated as a signal about a person in a particular job, not as a label for the person. The exhaustion is real and needs care. The cynicism usually makes sense once you look at what happened in that workplace, and that is where most of the work has to happen.
I see clients in English, French and Italian, at the practice in Gasperich (Luxembourg) on Saturdays or by video consultation on weekday evenings.
Request an appointmentReferences
- Ahola, K., Gould, R., Virtanen, M., Honkonen, T., Aromaa, A., & Lönnqvist, J. (2009). Occupational burnout as a predictor of disability pension: A population-based cohort study. Occupational and Environmental Medicine, 66(5), 284–290. https://doi.org/10.1136/oem.2008.038935
- Ahola, K., Honkonen, T., Isometsä, E., Kalimo, R., Nykyri, E., Aromaa, A., & Lönnqvist, J. (2005). The relationship between job-related burnout and depressive disorders: Results from the Finnish Health 2000 Study. Journal of Affective Disorders, 88(1), 55–62. https://doi.org/10.1016/j.jad.2005.06.004
- Ahola, K., Honkonen, T., Isometsä, E., Kalimo, R., Nykyri, E., Koskinen, S., Aromaa, A., & Lönnqvist, J. (2006). Burnout in the general population: Results from the Finnish Health 2000 Study. Social Psychiatry and Psychiatric Epidemiology, 41(1), 11–17. https://doi.org/10.1007/s00127-005-0011-5
- Ahola, K., Honkonen, T., Virtanen, M., Kivimäki, M., Isometsä, E., Aromaa, A., & Lönnqvist, J. (2007). Interventions in relation to occupational burnout: The population-based Health 2000 Study. Journal of Occupational and Environmental Medicine, 49(9), 943–952.
- Ahola, K., Kivimäki, M., Honkonen, T., Virtanen, M., Koskinen, S., Vahtera, J., & Lönnqvist, J. (2008). Occupational burnout and medically certified sickness absence: A population-based study of Finnish employees. Journal of Psychosomatic Research, 64(2), 185–193.
- Bakker, A. B., & Demerouti, E. (2017). Job demands–resources theory: Taking stock and looking forward. Journal of Occupational Health Psychology, 22(3), 273–285. https://doi.org/10.1037/ocp0000056
- Bianchi, R., Schonfeld, I. S., & Laurent, E. (2015). Burnout–depression overlap: A review. Clinical Psychology Review, 36, 28–41. https://doi.org/10.1016/j.cpr.2015.01.004
- Crawford, E. R., LePine, J. A., & Rich, B. L. (2010). Linking job demands and resources to employee engagement and burnout: A theoretical extension and meta-analytic test. Journal of Applied Psychology, 95(5), 834–848. https://doi.org/10.1037/a0019364
- Demerouti, E., Bakker, A. B., Nachreiner, F., & Schaufeli, W. B. (2001). The job demands–resources model of burnout. Journal of Applied Psychology, 86(3), 499–512. https://doi.org/10.1037/0021-9010.86.3.499
- Eurofound. (2018). Burnout in the workplace: A review of data and policy responses in the EU (C. Aumayr-Pintar, C. Cerf, & A. Parent-Thirion, Authors). Publications Office of the European Union. https://doi.org/10.2806/957351
- Freudenberger, H. J. (1974). Staff burn-out. Journal of Social Issues, 30(1), 159–165. https://doi.org/10.1111/j.1540-4560.1974.tb00706.x
- Gallup. (2017). State of the global workplace. Gallup Press. https://www.gallup.com/file/workplace/257552/State_Global_Workplace.pdf
- Halbesleben, J. R. B., & Demerouti, E. (2005). The construct validity of an alternative measure of burnout: Investigating the English translation of the Oldenburg Burnout Inventory. Work & Stress, 19(3), 208–220. https://doi.org/10.1080/02678370500340728
- Hobfoll, S. E. (1989). Conservation of resources: A new attempt at conceptualizing stress. American Psychologist, 44(3), 513–524. https://doi.org/10.1037/0003-066X.44.3.513
- Koutsimani, P., Montgomery, A., & Georganta, K. (2019). The relationship between burnout, depression, and anxiety: A systematic review and meta-analysis. Frontiers in Psychology, 10, 284. https://doi.org/10.3389/fpsyg.2019.00284
- Kristensen, T. S., Borritz, M., Villadsen, E., & Christensen, K. B. (2005). The Copenhagen Burnout Inventory: A new tool for the assessment of burnout. Work & Stress, 19(3), 192–207. https://doi.org/10.1080/02678370500297720
- Leiter, M. P., & Maslach, C. (2004). Areas of worklife: A structured approach to organizational predictors of job burnout. In P. L. Perrewé & D. C. Ganster (Eds.), Research in occupational stress and well-being (Vol. 3, pp. 91–134). Elsevier.
- Maslach, C., & Jackson, S. E. (1981). The measurement of experienced burnout. Journal of Occupational Behaviour, 2(2), 99–113. https://doi.org/10.1002/job.4030020205
- Maslach, C., & Leiter, M. P. (2016). Understanding the burnout experience: Recent research and its implications for psychiatry. World Psychiatry, 15(2), 103–111. https://doi.org/10.1002/wps.20311
- Maslach, C., Schaufeli, W. B., & Leiter, M. P. (2001). Job burnout. Annual Review of Psychology, 52, 397–422. https://doi.org/10.1146/annurev.psych.52.1.397
- Panagioti, M., Panagopoulou, E., Bower, P., Lewith, G., Kontopantelis, E., Chew-Graham, C., Dawson, S., van Marwijk, H., Geraghty, K., & Esmail, A. (2017). Controlled interventions to reduce burnout in physicians: A systematic review and meta-analysis. JAMA Internal Medicine, 177(2), 195–205. https://doi.org/10.1001/jamainternmed.2016.7674
- Rotenstein, L. S., Torre, M., Ramos, M. A., Rosales, R. C., Guille, C., Sen, S., & Mata, D. A. (2018). Prevalence of burnout among physicians: A systematic review. JAMA, 320(11), 1131–1150. https://doi.org/10.1001/jama.2018.12777
- Salvagioni, D. A. J., Melanda, F. N., Mesas, A. E., González, A. D., Gabani, F. L., & de Andrade, S. M. (2017). Physical, psychological and occupational consequences of job burnout: A systematic review of prospective studies. PLOS ONE, 12(10), e0185781. https://doi.org/10.1371/journal.pone.0185781
- Schaufeli, W. B., & Bakker, A. B. (2004). Job demands, job resources, and their relationship with burnout and engagement: A multi-sample study. Journal of Organizational Behavior, 25(3), 293–315. https://doi.org/10.1002/job.248
- Schaufeli, W. B., Bakker, A. B., & Salanova, M. (2006). The measurement of work engagement with a short questionnaire: A cross-national study. Educational and Psychological Measurement, 66(4), 701–716. https://doi.org/10.1177/0013164405282471
- Schaufeli, W. B., De Witte, H., & Desart, S. (2019). Manual: Burnout Assessment Tool (BAT). KU Leuven, Belgium: Internal report.
- Schaufeli, W. B., Leiter, M. P., Maslach, C., & Jackson, S. E. (1996). Maslach Burnout Inventory–General Survey. In C. Maslach, S. E. Jackson, & M. P. Leiter (Eds.), Maslach Burnout Inventory manual (3rd ed.). Consulting Psychologists Press.
- Schaufeli, W. B., Salanova, M., González-Romá, V., & Bakker, A. B. (2002). The measurement of engagement and burnout: A two sample confirmatory factor analytic approach. Journal of Happiness Studies, 3(1), 71–92. https://doi.org/10.1023/A:1015630930326
- West, C. P., Dyrbye, L. N., Erwin, P. J., & Shanafelt, T. D. (2016). Interventions to prevent and reduce physician burnout: A systematic review and meta-analysis. The Lancet, 388(10057), 2272–2281. https://doi.org/10.1016/S0140-6736(16)31279-X
- Wigert, B., & Agrawal, S. (2018, July 12). Employee burnout, part 1: The 5 main causes. Gallup. https://www.gallup.com/workplace/237059/employee-burnout-part-main-causes.aspx
- World Health Organization. (2018). International classification of diseases for mortality and morbidity statistics (11th rev.). QD85 Burn-out. https://icd.who.int/browse11/l-m/en#/http://id.who.int/icd/entity/129180281
© 2019 Giampaolo Penzo. All rights reserved. No reproduction, translation or reuse, including for AI training, without the author's written permission. Short quotations are welcome with credit and a link to this page. Legal notice