Publications
Measuring Anxiety: Psychometric Instruments and Their Properties
Key points
- A score on an anxiety questionnaire is an estimate that carries error. Reliability, validity and cut-offs describe how a score behaves in a given population, so they travel badly from one setting to another.
- The GAD-7 is the best-studied brief screener. In its validation study a score of 10 or more picked up 89% of people with generalized anxiety disorder and correctly cleared 82% of those without it.
- The anxiety scales of the HADS and the DASS measure a good deal of general distress alongside anxiety. That is useful for screening and less useful for telling one disorder from another.
- A test can work well in one group and differently in another. The GAD-7 has shown equivalent structure in men and women; the DASS-21 has shown only partial equivalence between countries.
- Dimensional models such as HiTOP fit the data better than the DSM categories, but clinical decisions still need thresholds.
Introduction
If anxiety is a matter of degree, how do we put a number on it, and how much should we trust that number?
Most of the measurement in everyday practice is done with short questionnaires. A general practitioner hands out the GAD-7 in the waiting room, a hospital ward uses the HADS, a clinical trial tracks change with the Liebowitz scale or the Panic Disorder Severity Scale. These instruments are cheap and fast, and they have been tested on hundreds of thousands of people. They are also easy to misread. A total score looks like a measurement of the same kind as a blood pressure reading, while it is closer to an estimate built from a person's answers to a handful of questions, in one language, at one moment.
This article goes through seven of the most used instruments: the State-Trait Anxiety Inventory (STAI), the Beck Anxiety Inventory (BAI), the GAD-7, the Hospital Anxiety and Depression Scale (HADS), the Depression Anxiety Stress Scales (DASS), the Liebowitz Social Anxiety Scale (LSAS) and the Panic Disorder Severity Scale (PDSS). For each one I report what the validation studies found about reliability, validity and cut-off scores. I then look at two questions that matter more and more as these tools spread across countries: whether they measure the same thing in men and women and in different cultures, and whether anxiety should be measured as a set of categories at all.
What makes a good measure
Psychometrics judges an instrument on a small number of properties. None of them belongs to the questionnaire itself. Each is estimated in a sample, and the estimate can change when the sample changes.
The first property is reliability, the share of the variation in scores that reflects real differences between people rather than noise. The most reported index is Cronbach's alpha, which looks at how consistently the items of a scale move together. Values above .80 are usually considered good for research and above .90 for decisions about individuals. Alpha has known limits: it rises with the number of items, and it assumes that all items weigh equally on one factor, which is rarely the case. Test-retest reliability adds a different piece of information, namely how stable a score is over days or weeks when nothing should have changed. For a state measure, low stability is expected; for a trait measure it is a problem.
Validity asks whether the score means what we say it means. In practice it is built from several sources of evidence. Convergent validity is shown by high correlations with other measures of anxiety; discriminant validity by lower correlations with measures of related but different constructs, depression above all. Structural validity is checked with factor analysis, to see whether the items group the way the authors intended. Criterion validity compares the score with an independent diagnosis, usually a structured clinical interview.
Cut-off scores turn a continuous score into a yes or no. Any cut-off trades sensitivity (the proportion of true cases it detects) against specificity (the proportion of non-cases it correctly clears). Lowering the threshold catches more cases and produces more false alarms. A receiver operating characteristic (ROC) curve shows this trade-off for every possible threshold, plotting sensitivity against the false positive rate (1 minus specificity). The area under the curve (AUC) summarizes the whole curve: 0.5 means the test does no better than chance, 1.0 means perfect separation.
Sensitivity and specificity are only half the story for the person in front of us. What a clinician wants to know is the probability that a positive screen is a true case, the positive predictive value, and that depends on how common the disorder is. A simple calculation makes the point. Take a test with sensitivity .89 and specificity .82 and apply it to 1,000 people in a setting where 5% have the disorder. It will flag about 45 of the 50 true cases and about 171 of the 950 people without the disorder. Of the 216 positive screens, only one in five is a true case. In a specialist clinic where half the patients have the disorder, the same test gives a positive predictive value above 80%. A cut-off is a decision rule for a specific population, and it should be read that way.
The instruments one by one
State-Trait Anxiety Inventory (STAI)
The STAI is the oldest of the group and still one of the most cited. Form Y (Spielberger, 1983) has 40 items rated on a four-point scale: 20 ask how the person feels right now (state anxiety) and 20 how they generally feel (trait anxiety). The distinction is its main strength, because it allows a researcher to separate a reaction to a situation from a stable disposition. Internal consistency is high, with alphas between .86 and .95 across samples (Julian, 2011). The STAI was built as a research measure and has no official diagnostic threshold. Scores of 39 to 40 have been suggested as a marker of clinically relevant state anxiety, and 54 to 55 in older adults (Julian, 2011). At 40 items it is also the longest instrument in this list.
Beck Anxiety Inventory (BAI)
Beck and colleagues (1988) designed the BAI with one specific goal: to measure anxiety while overlapping as little as possible with depression. The 21 items describe symptoms rated from 0 to 3 for the past week, and most of them are bodily: numbness, feeling hot, wobbly legs, a pounding heart, dizziness. In the original psychiatric outpatient sample alpha was .92 and one-week test-retest reliability .75. The BAI correlated .51 with the clinician-rated Hamilton Anxiety Rating Scale and only .25 with the Hamilton depression scale, which supports the aim of separation. The price is a strong somatic slant. People whose anxiety is mainly cognitive, such as chronic worriers, can score low, while people with medical conditions that cause palpitations or dizziness can score high for reasons that have nothing to do with anxiety.
GAD-7
The GAD-7 (Spitzer et al., 2006) was developed in primary care, and its brevity explains much of its success. Seven items cover the past two weeks, each scored 0 to 3, for a total between 0 and 21. Scores of 5, 10 and 15 mark mild, moderate and severe anxiety. In the validation study, criterion validity was tested against interviews by mental health professionals. Alpha was .92 and test-retest reliability (intraclass correlation) .83. At the recommended cut-off of 10, sensitivity for generalized anxiety disorder was .89 and specificity .82, and the scale also performed reasonably for panic disorder, social anxiety and PTSD. That last result says something about what the GAD-7 measures: anxious distress shared across disorders more than generalized anxiety disorder in a strict sense. A meta-analysis of later studies found that a cut-off of 8 gave a better balance, with pooled sensitivity .83 and specificity .84, and that thresholds from 7 to 10 performed similarly (Plummer et al., 2016).
Hospital Anxiety and Depression Scale (HADS)
Zigmond and Snaith (1983) wrote the HADS for patients in general hospital clinics, where symptoms such as fatigue, insomnia or palpitations may come from the physical illness. They left those symptoms out. The scale has 14 items, seven for anxiety (HADS-A) and seven for depression, each rated for the past week. On each subscale, 8 to 10 was proposed as a possible case and 11 or more as a probable case. A large review found alphas for HADS-A between .68 and .93, with a mean of .83, and an optimal balance of sensitivity and specificity, both close to .80, at a cut-off of 8 (Bjelland et al., 2002). The two-factor structure has been debated for years. A pooled analysis of 28 samples found the best fit for a bifactor model, in which a general distress factor accounted for most of the shared variance, and concluded that the HADS should be used as a measure of general distress (Norton et al., 2013).
Depression Anxiety Stress Scales (DASS)
The DASS (Lovibond & Lovibond, 1995) has 42 items, and a 21-item short form is used much more often. It has three scales. Depression covers low mood and anhedonia; anxiety covers autonomic arousal, situational anxiety and the subjective experience of fear; stress covers tension, irritability and difficulty relaxing. The stress scale is closer than the anxiety scale to what clinicians call worry, a point worth remembering when the DASS is used for generalized anxiety. In clinical samples, internal consistency ranged from acceptable to excellent (Antony et al., 1998). In a sample of 1,794 adults from the general population in the United Kingdom, alphas were .88 for depression, .82 for anxiety and .90 for stress (Henry & Crawford, 2005). The same study found that the three scales also share a general distress factor. The manual provides severity ranges from normal to extremely severe; the DASS is a dimensional measure and does not offer a diagnostic cut-off.
Liebowitz Social Anxiety Scale (LSAS)
The LSAS (Liebowitz, 1987) lists 24 situations, 13 involving performance and 11 involving social interaction. Each situation is rated twice, once for fear and once for avoidance, on scales from 0 to 3, for a total of 0 to 144. It was designed to be administered by a clinician, but the self-report version has comparable psychometric properties (Fresco et al., 2001). Heimberg and colleagues (1999), with 382 patients, reported excellent internal consistency, good convergent validity and sensitivity to treatment; they also noted that the fear and avoidance subscales may not be distinct enough in clinical samples. ROC analyses found that a total of 30 best separated people with social anxiety disorder from controls, and a total of 60 best identified the generalized subtype (Mennin et al., 2002). The same two thresholds held for the self-report version in 291 patients and 53 controls (Rytwinski et al., 2009).
Panic Disorder Severity Scale (PDSS)
The PDSS (Shear et al., 1997) is a seven-item rating of panic disorder severity modeled on the Yale-Brown Obsessive Compulsive Scale. The items cover attack frequency, distress during attacks, anticipatory anxiety, avoidance of situations, avoidance of bodily sensations, and impairment at work and in social life. Each item is scored 0 to 4, for a total of 0 to 28. In the first study, with 186 patients, interrater reliability was excellent and internal consistency moderate (alpha .65). The low alpha makes sense: the items describe different aspects of the disorder that need not rise together. A second study in 104 outpatients confirmed a single factor and found that a cut-off of 8 identified current panic disorder with a sensitivity of 83.3% and a specificity of 64% (Shear et al., 2001). The self-report version showed an alpha of .92 and good test-retest reliability (Houck et al., 2002). The PDSS is meant to rate severity in people already diagnosed, and evidence-based ranges link its scores to clinical global ratings (Furukawa et al., 2009).
The instruments side by side
| Instrument | Items | Format | Time frame | Alpha | Common cut-off | Sensitivity / specificity at cut-off |
|---|---|---|---|---|---|---|
| STAI (Form Y) | 40 (20 state, 20 trait) | Self-report, 1 to 4 | Now / in general | .86 to .95 | 39 to 40 (state), proposed | Not established |
| BAI | 21 | Self-report, 0 to 3 | Past week | .92 | Severity ranges only | Not established |
| GAD-7 | 7 | Self-report, 0 to 3 | Past 2 weeks | .92 | 10 (8 in meta-analysis) | .89 / .82 (at 10); .83 / .84 (at 8) |
| HADS-A | 7 (of 14) | Self-report, 0 to 3 | Past week | .68 to .93 (mean .83) | 8 | about .80 / .80 |
| DASS-21 Anxiety | 7 (of 21) | Self-report, 0 to 3 | Past week | .82 | Severity ranges only | Not established |
| LSAS | 24 situations, 48 ratings | Clinician or self-report, 0 to 3 | Past week | Excellent | 30 (SAD); 60 (generalized) | Best balance at 30 and 60 |
| PDSS | 7 | Clinician or self-report, 0 to 4 | Past month | .65 (interview); .92 (self-report) | 8 | .83 / .64 |
Sources: Spielberger (1983); Julian (2011); Beck et al. (1988); Spitzer et al. (2006); Plummer et al. (2016); Zigmond & Snaith (1983); Bjelland et al. (2002); Lovibond & Lovibond (1995); Henry & Crawford (2005); Liebowitz (1987); Heimberg et al. (1999); Mennin et al. (2002); Rytwinski et al. (2009); Shear et al. (1997, 2001); Houck et al. (2002).
Reliability compared
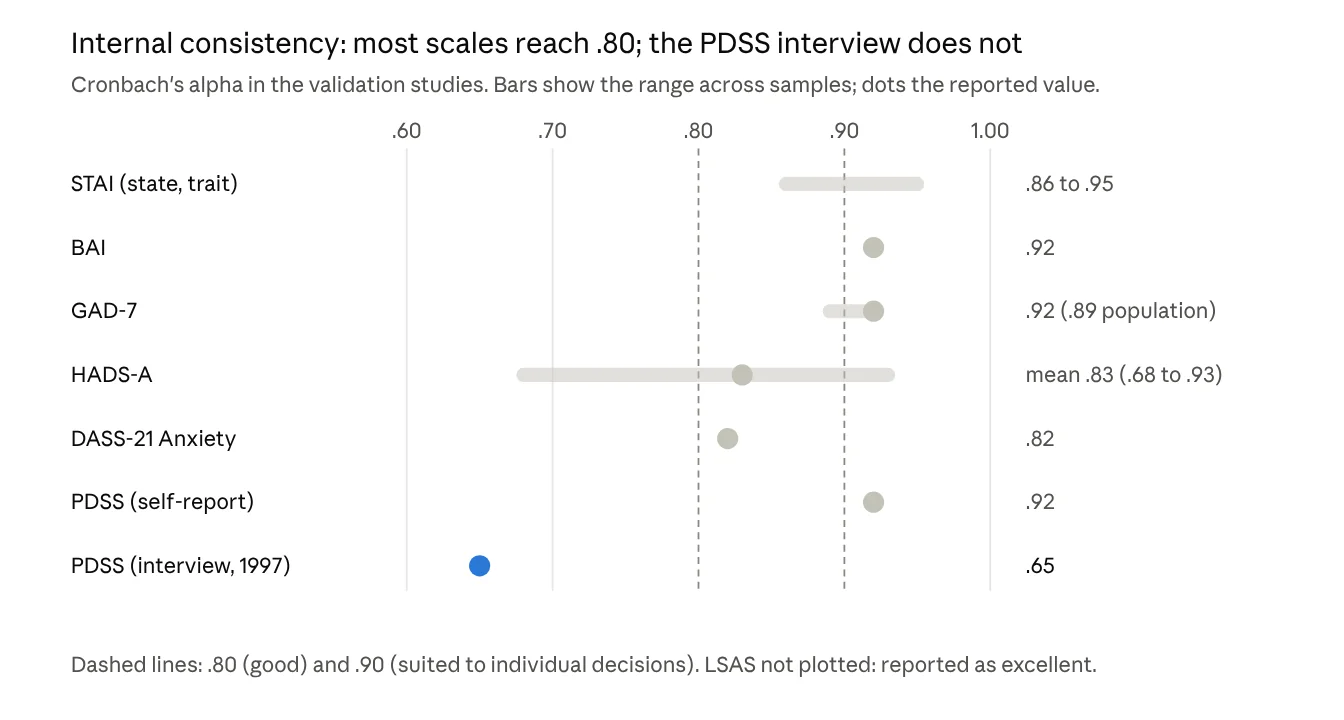
On internal consistency the instruments look much alike. Almost every estimate sits above .80, and several above .90. Two things stand out in the chart. The HADS anxiety scale has the widest spread, from .68 to .93 depending on the sample: alpha describes scores in a given population, and the same seven items work better in some groups than in others. The clinician version of the PDSS, at .65, is the only estimate below the conventional threshold. Its authors described this as moderate consistency and it follows from the design, since the items rate different aspects of panic disorder. In a later outpatient sample, alpha was above .90 for both the interview and the self-report version (Houck et al., 2002).
A high alpha says that the items move together. It does not show that they measure only anxiety. The HADS and the DASS reach good alphas while carrying a large general distress component (Norton et al., 2013; Henry & Crawford, 2005), and the 20-item scales of the STAI benefit from their length, because alpha rises with the number of items.
Screening accuracy
Four of the seven instruments have published cut-offs tested against a diagnostic interview: the GAD-7, the HADS, the LSAS and the PDSS. The GAD-7 is the only one whose validation paper reports sensitivity and specificity across a whole run of thresholds, which makes it possible to draw its ROC curve directly from the published figures.
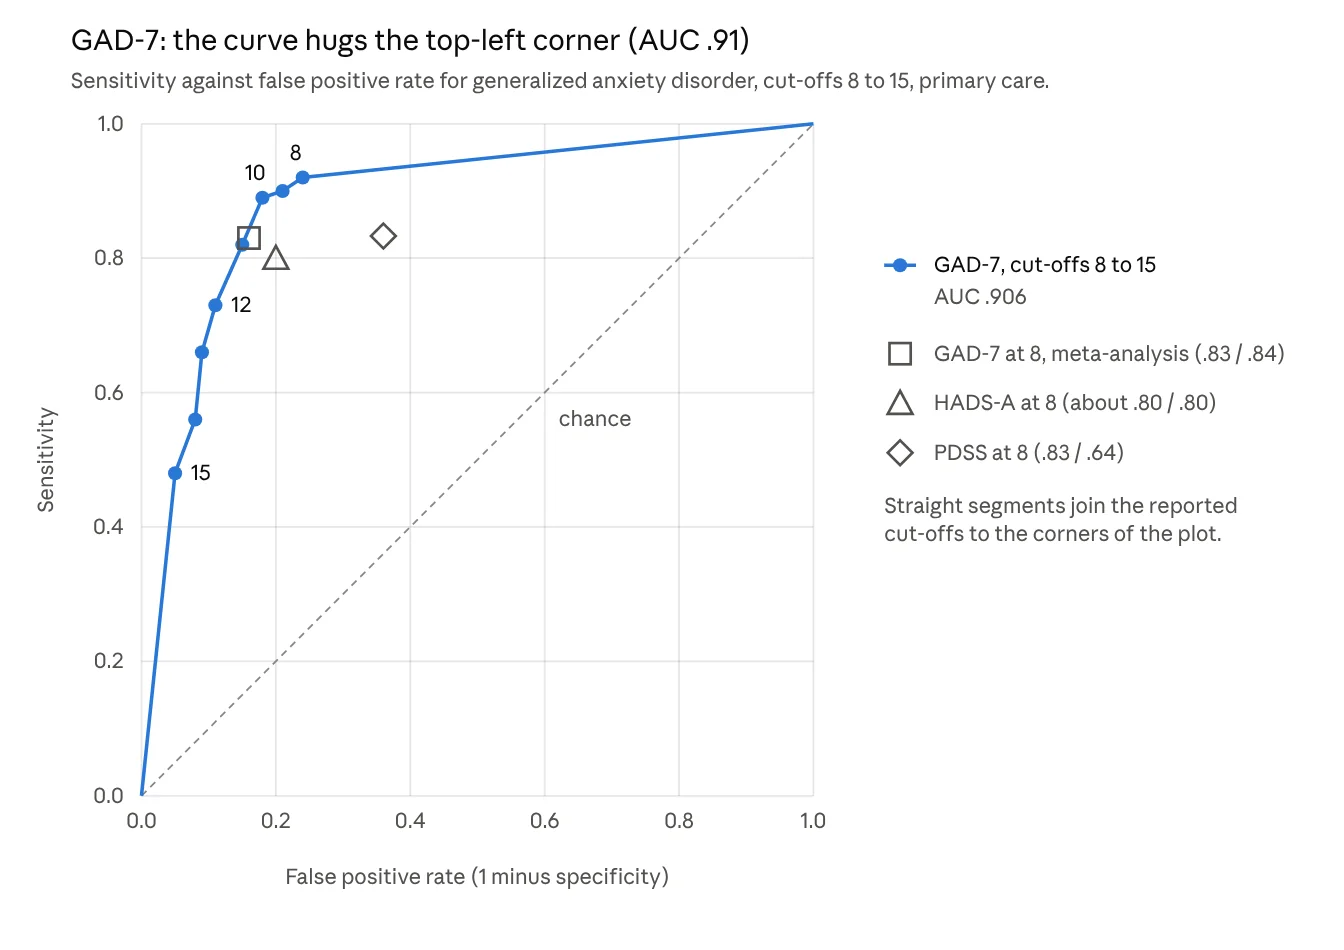
The GAD-7 curve sits well above the diagonal that marks chance, with an area under the curve of .906 for generalized anxiety disorder (Spitzer et al., 2006). The curve also shows the cost of each step. Moving the threshold from 10 down to 8 gains three points of sensitivity and loses six of specificity; moving it up to 15 halves sensitivity in exchange for very few false positives. The pooled estimate at 8 from later studies (Plummer et al., 2016) lands close to the original curve, which is reassuring for a scale now used in many countries and settings.
The other points need more care, because they come from different populations. The HADS anxiety scale at 8 performs a little below the GAD-7 curve, in a review that pooled very heterogeneous samples (Bjelland et al., 2002). The PDSS at 8 has good sensitivity and modest specificity, as expected from a scale built to rate severity in patients who already have a diagnosis (Shear et al., 2001). The LSAS thresholds of 30 and 60 came from ROC analyses as well (Mennin et al., 2002), but in a comparison between patients and healthy controls. Studies of that design tend to overestimate accuracy, since the hard cases, people with other disorders or with symptoms just below threshold, are missing.
Does the test measure the same thing in everyone?
Women report more anxiety than men on almost every questionnaire, and scores differ between countries. Before reading those differences as real, we need to know whether the instrument works the same way in each group. This is the question of measurement invariance, and it is tested in steps with multi-group confirmatory factor analysis.
The first step, configural invariance, asks whether the same items load on the same factors in every group. The second, metric or weak invariance, asks whether the loadings are equal, so that a one-point change means the same thing everywhere; it is needed to compare correlations. The third, scalar or strong invariance, adds equal item intercepts, meaning that people with the same level of anxiety give the same expected answers whatever group they belong to. Only at this level can group means be compared. When some parameters have to be freed to reach acceptable fit, the result is called partial invariance, and comparisons rest on the items that behave the same way.
The GAD-7 has a good record here. In a sample of 5,030 people from the German general population, a single factor fitted the data, and the structure held across gender and age groups (Löwe et al., 2008). Women scored higher than men, with means of 3.2 and 2.7, and since the scale proved invariant this gap can be taken as a difference in anxiety rather than in the way men and women read the items.
The DASS-21 shows what happens between cultures. Comparing 1,841 participants from Pakistan with 1,323 from Germany, Bibi and colleagues (2020) found partial strong invariance for the depression and anxiety scales and only partial weak invariance for the stress scale. Anxiety means can be compared between the two countries with some caution; stress means cannot. A likely reason is that the stress items describe states, such as irritability or feeling touchy, whose meaning and acceptability vary with cultural norms.
The structural question returns with the HADS. If most of the shared variance in its items belongs to a general distress factor (Norton et al., 2013), a separate anxiety score adds less than its name suggests, and any comparison between groups inherits that ambiguity. Invariance is often assumed and less often tested. A translated questionnaire with good alpha in a new country has shown that its items hang together there; it has not yet shown that its scores can be put on the same ruler as the original.
Dimensions or categories?
All the cut-offs discussed so far assume that there is a category to detect: a person either has generalized anxiety disorder or does not. The DSM-5 (American Psychiatric Association, 2013) and the ICD-11, which came into force on 1 January 2022 (World Health Organization, 2022), still work this way, although both include severity ratings and the ICD-11 is more flexible in its descriptions.
The Hierarchical Taxonomy of Psychopathology (HiTOP) starts from a different premise. It was built by a consortium of researchers from the patterns of co-occurrence between symptoms found in large samples, and it describes psychopathology as a set of continuous dimensions arranged in levels (Kotov et al., 2017). At the top is a broad internalizing spectrum. Below it, a distress subfactor groups generalized anxiety disorder with major depression, dysthymia and PTSD, while a fear subfactor groups panic disorder, agoraphobia, social anxiety and specific phobias. Further down are narrower symptom components and maladaptive traits.
The arguments for this model come from the known weaknesses of categories. The DSM categories often show modest reliability between clinicians, high comorbidity, and wide heterogeneity within the same diagnosis, while dimensional scores are more reliable and predict outcomes such as impairment and course at least as well (Kotov et al., 2021). Seen from HiTOP, the general distress factor that keeps appearing in the HADS and the DASS is an expected finding, since it corresponds to the higher levels of the hierarchy. The fact that the GAD-7 detects panic disorder and social anxiety almost as well as generalized anxiety disorder fits the same picture.
A dimensional model does not remove the need for decisions. A general practitioner has to decide whether to refer, a clinician whether to treat, an insurer whether to pay. Each of those decisions draws a line on a continuum. What HiTOP changes is the status of that line: it becomes a threshold chosen for a purpose, which can be moved and evaluated against outcomes. Kotov and colleagues (2021) say clearly that the model is still being refined, especially at its lower levels, and that tools for using it in routine practice are only now being developed.
Which instrument for which purpose
No instrument is best in general. The choice depends on what the score will be used for and on the population in which it will be used.
| Purpose | Suggested instrument | Caution |
|---|---|---|
| Brief screening in primary care or online | GAD-7 | Choose the cut-off for the setting: 10 favors specificity, 8 sensitivity |
| Patients with physical illness | HADS-A | Read the score as general distress more than as a specific anxiety disorder |
| Separating state from trait anxiety in research | STAI | 40 items, no validated diagnostic threshold |
| Profile of depression, anxiety and stress | DASS-21 | Check invariance before comparing groups, especially on the stress scale |
| Bodily symptoms of anxiety and panic | BAI | Somatic items can be inflated by medical conditions |
| Social anxiety, assessment and treatment outcome | LSAS (clinician or self-report) | Cut-offs of 30 and 60 derived from patient versus control comparisons |
| Severity and change in diagnosed panic disorder | PDSS | Built for severity, with low specificity as a screener |
Two rules hold for all of them. A positive screen is a reason for a clinical interview, never a diagnosis; how likely it is to be right depends on how common the disorder is in the group being screened. And published cut-offs and alphas come from specific samples, so when a test is used in a different population, in another language or with a different age group, the first thing to look for is evidence that it was validated there.
I see clients in English, French and Italian, at the practice in Gasperich (Luxembourg) on Saturdays or by video consultation on weekday evenings.
Request an appointmentReferences
- American Psychiatric Association. (2013). Diagnostic and statistical manual of mental disorders (5th ed.). American Psychiatric Publishing. https://doi.org/10.1176/appi.books.9780890425596
- Antony, M. M., Bieling, P. J., Cox, B. J., Enns, M. W., & Swinson, R. P. (1998). Psychometric properties of the 42-item and 21-item versions of the Depression Anxiety Stress Scales in clinical groups and a community sample. Psychological Assessment, 10(2), 176–181. https://doi.org/10.1037/1040-3590.10.2.176
- Beck, A. T., Epstein, N., Brown, G., & Steer, R. A. (1988). An inventory for measuring clinical anxiety: Psychometric properties. Journal of Consulting and Clinical Psychology, 56(6), 893–897. https://doi.org/10.1037/0022-006X.56.6.893
- Bibi, A., Lin, M., Zhang, X. C., & Margraf, J. (2020). Psychometric properties and measurement invariance of Depression, Anxiety and Stress Scales (DASS-21) across cultures. International Journal of Psychology, 55(6), 916–925. https://doi.org/10.1002/ijop.12671
- Bjelland, I., Dahl, A. A., Haug, T. T., & Neckelmann, D. (2002). The validity of the Hospital Anxiety and Depression Scale: An updated literature review. Journal of Psychosomatic Research, 52(2), 69–77. https://doi.org/10.1016/S0022-3999(01)00296-3
- Fresco, D. M., Coles, M. E., Heimberg, R. G., Liebowitz, M. R., Hami, S., Stein, M. B., & Goetz, D. (2001). The Liebowitz Social Anxiety Scale: A comparison of the psychometric properties of self-report and clinician-administered formats. Psychological Medicine, 31(6), 1025–1035. https://doi.org/10.1017/S0033291701004056
- Furukawa, T. A., Shear, M. K., Barlow, D. H., Gorman, J. M., Woods, S. W., Money, R., Etschel, E., Engel, R. R., & Leucht, S. (2009). Evidence-based guidelines for interpretation of the Panic Disorder Severity Scale. Depression and Anxiety, 26(10), 922–929. https://doi.org/10.1002/da.20532
- Heimberg, R. G., Horner, K. J., Juster, H. R., Safren, S. A., Brown, E. J., Schneier, F. R., & Liebowitz, M. R. (1999). Psychometric properties of the Liebowitz Social Anxiety Scale. Psychological Medicine, 29(1), 199–212. https://doi.org/10.1017/S0033291798007879
- Henry, J. D., & Crawford, J. R. (2005). The short-form version of the Depression Anxiety Stress Scales (DASS-21): Construct validity and normative data in a large non-clinical sample. British Journal of Clinical Psychology, 44(2), 227–239. https://doi.org/10.1348/014466505X29657
- Houck, P. R., Spiegel, D. A., Shear, M. K., & Rucci, P. (2002). Reliability of the self-report version of the Panic Disorder Severity Scale. Depression and Anxiety, 15(4), 183–185. https://doi.org/10.1002/da.10049
- Julian, L. J. (2011). Measures of anxiety: State-Trait Anxiety Inventory (STAI), Beck Anxiety Inventory (BAI), and Hospital Anxiety and Depression Scale-Anxiety (HADS-A). Arthritis Care & Research, 63(S11), S467–S472. https://doi.org/10.1002/acr.20561
- Kotov, R., Krueger, R. F., Watson, D., Achenbach, T. M., Althoff, R. R., Bagby, R. M., Brown, T. A., Carpenter, W. T., Caspi, A., Clark, L. A., Eaton, N. R., Forbes, M. K., Forbush, K. T., Goldberg, D., Hasin, D., Hyman, S. E., Ivanova, M. Y., Lynam, D. R., Markon, K., … Zimmerman, M. (2017). The Hierarchical Taxonomy of Psychopathology (HiTOP): A dimensional alternative to traditional nosologies. Journal of Abnormal Psychology, 126(4), 454–477. https://doi.org/10.1037/abn0000258
- Kotov, R., Krueger, R. F., Watson, D., Cicero, D. C., Conway, C. C., DeYoung, C. G., Eaton, N. R., Forbes, M. K., Hallquist, M. N., Latzman, R. D., Mullins-Sweatt, S. N., Ruggero, C. J., Simms, L. J., Waldman, I. D., Waszczuk, M. A., & Wright, A. G. C. (2021). The Hierarchical Taxonomy of Psychopathology (HiTOP): A quantitative nosology based on consensus of evidence. Annual Review of Clinical Psychology, 17, 83–108. https://doi.org/10.1146/annurev-clinpsy-081219-093304
- Liebowitz, M. R. (1987). Social phobia. Modern Problems of Pharmacopsychiatry, 22, 141–173. https://doi.org/10.1159/000414022
- Lovibond, S. H., & Lovibond, P. F. (1995). Manual for the Depression Anxiety Stress Scales (2nd ed.). Psychology Foundation.
- Löwe, B., Decker, O., Müller, S., Brähler, E., Schellberg, D., Herzog, W., & Herzberg, P. Y. (2008). Validation and standardization of the Generalized Anxiety Disorder Screener (GAD-7) in the general population. Medical Care, 46(3), 266–274. https://doi.org/10.1097/MLR.0b013e318160d093
- Mennin, D. S., Fresco, D. M., Heimberg, R. G., Schneier, F. R., Davies, S. O., & Liebowitz, M. R. (2002). Screening for social anxiety disorder in the clinical setting: Using the Liebowitz Social Anxiety Scale. Journal of Anxiety Disorders, 16(6), 661–673. https://doi.org/10.1016/S0887-6185(02)00134-2
- Norton, S., Cosco, T., Doyle, F., Done, J., & Sacker, A. (2013). The Hospital Anxiety and Depression Scale: A meta confirmatory factor analysis. Journal of Psychosomatic Research, 74(1), 74–81. https://doi.org/10.1016/j.jpsychores.2012.10.010
- Plummer, F., Manea, L., Trepel, D., & McMillan, D. (2016). Screening for anxiety disorders with the GAD-7 and GAD-2: A systematic review and diagnostic metaanalysis. General Hospital Psychiatry, 39, 24–31. https://doi.org/10.1016/j.genhosppsych.2015.11.005
- Rytwinski, N. K., Fresco, D. M., Heimberg, R. G., Coles, M. E., Liebowitz, M. R., Cissell, S., Stein, M. B., & Hofmann, S. G. (2009). Screening for social anxiety disorder with the self-report version of the Liebowitz Social Anxiety Scale. Depression and Anxiety, 26(1), 34–38. https://doi.org/10.1002/da.20503
- Shear, M. K., Brown, T. A., Barlow, D. H., Money, R., Sholomskas, D. E., Woods, S. W., Gorman, J. M., & Papp, L. A. (1997). Multicenter collaborative Panic Disorder Severity Scale. American Journal of Psychiatry, 154(11), 1571–1575. https://doi.org/10.1176/ajp.154.11.1571
- Shear, M. K., Rucci, P., Williams, J., Frank, E., Grochocinski, V., Vander Bilt, J., Houck, P., & Wang, T. (2001). Reliability and validity of the Panic Disorder Severity Scale: Replication and extension. Journal of Psychiatric Research, 35(5), 293–296. https://doi.org/10.1016/S0022-3956(01)00028-0
- Spielberger, C. D., Gorsuch, R. L., Lushene, R., Vagg, P. R., & Jacobs, G. A. (1983). Manual for the State-Trait Anxiety Inventory (Form Y). Consulting Psychologists Press.
- Spitzer, R. L., Kroenke, K., Williams, J. B. W., & Löwe, B. (2006). A brief measure for assessing generalized anxiety disorder: The GAD-7. Archives of Internal Medicine, 166(10), 1092–1097. https://doi.org/10.1001/archinte.166.10.1092
- World Health Organization. (2022). International classification of diseases for mortality and morbidity statistics (11th rev.). https://icd.who.int/browse11
- Zigmond, A. S., & Snaith, R. P. (1983). The Hospital Anxiety and Depression Scale. Acta Psychiatrica Scandinavica, 67(6), 361–370. https://doi.org/10.1111/j.1600-0447.1983.tb09716.x
© 2022 Giampaolo Penzo. All rights reserved. No reproduction, translation or reuse, including for AI training, without the author's written permission. Short quotations are welcome with credit and a link to this page. Legal notice